 |
This is the SQLGrid workspace. The top pane
contains SQL editor with context highlighting. The bottom pane
contains the output and is generated in HTML so you can copy and paste
into into Word documents, etc... Click here
to see the HTML report. |
 |
The login dialog saves a history of connections. If
you omit a user name and password, a connection will be attempted using
NT Authentication. |
 |
This screen shot shows the schema browser on the
right. You can use drag-and-drop editing from the browser to the
editor.
The sample output on the bottom shows the execution plan and statistics
for the executed query. Click here to see
the actual HTML report. |
 |
This is an example of a describe on a table. Note
that not only is the table described, but also it's constraints,
indexes, etc... Click here to see
the full HTML description. |
 |
The options dialog allows you to specify how you want
SQLGrid to behave. You can control the contents of the report, the
size of the font user to generate the report, where the report is
positioned, etc...
(Animated) |
 |
This is the Scrapbook dialog. The scrapbook allows
you to build a library of commonly executed queries. The scrapbook
supports drag-and-drop editing. |
 |
This is the history window which allows you to review and
reuse the queries you've executed. The history tool also supports
drag-and-drop editing. |
 |
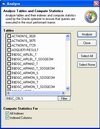
The analyze tool allows you to analyze tables and their
indexes and compute statistics used by the Oracle optimizer to ensure
that queries are executed in the most performant manor. |
 |
The repair tool utility allows you to repair by
compilation, any objects that have become invalid in the current Oracle
schema. |
 |
Using the statistics tool, you can connect statistic for
any query you execute. This is extremely useful with performing
database tuning exercises. |
 |
This dialog can be opened from the statistics dialog and
allows you to select what statistics you would like to collect from
Oracle. |